PHP Plot Graph: Render graph charts of several types as images
| Recommend this page to a friend! |
| Info | Reputation | Support forum | Blog | Links |
| Ratings | Unique User Downloads | Download Rankings | ||||
| Not enough user ratings | Total: 122 | All time: 9,470 This week: 524 | ||||
| Version | License | PHP version | Categories | |||
| php-libplot 1.0.0 | GNU General Publi... | 5 | PHP 5, Graphics, Statistics |
| Description | Author | |||||||||||||||||||
This class can render graph charts of several types as images. |
| |||||||||||||||||||


Example
<?php |
Details
php-libplot. Written in PHP. Graphs charts, scatter, plot, lines, custom graphs
Matplotlib. Pyplot written in PHP. Graphs charts, scatter, plot, lines, custom graphs
V.1.0.0
This class starts with the need to create graphics in the style of MatLibPlot, but in pure PHP language due to the use on shared servers with access restrictions to the system to install third-party applications. This first version performs a great variety of the best pyplot functions, combined with mathematical numpy functions commonly used in Machine Learning as linspace or arraypow.
It is based on the same functions already prepared intentionally with a regular use of MatibPlot and also written in PHP https://github.com/vivesweb/graph-php. That is why it is recommended to also read the documentation of this second class, where most of the methods used by PHP-LibPlot are original provided.
SAMPLES:
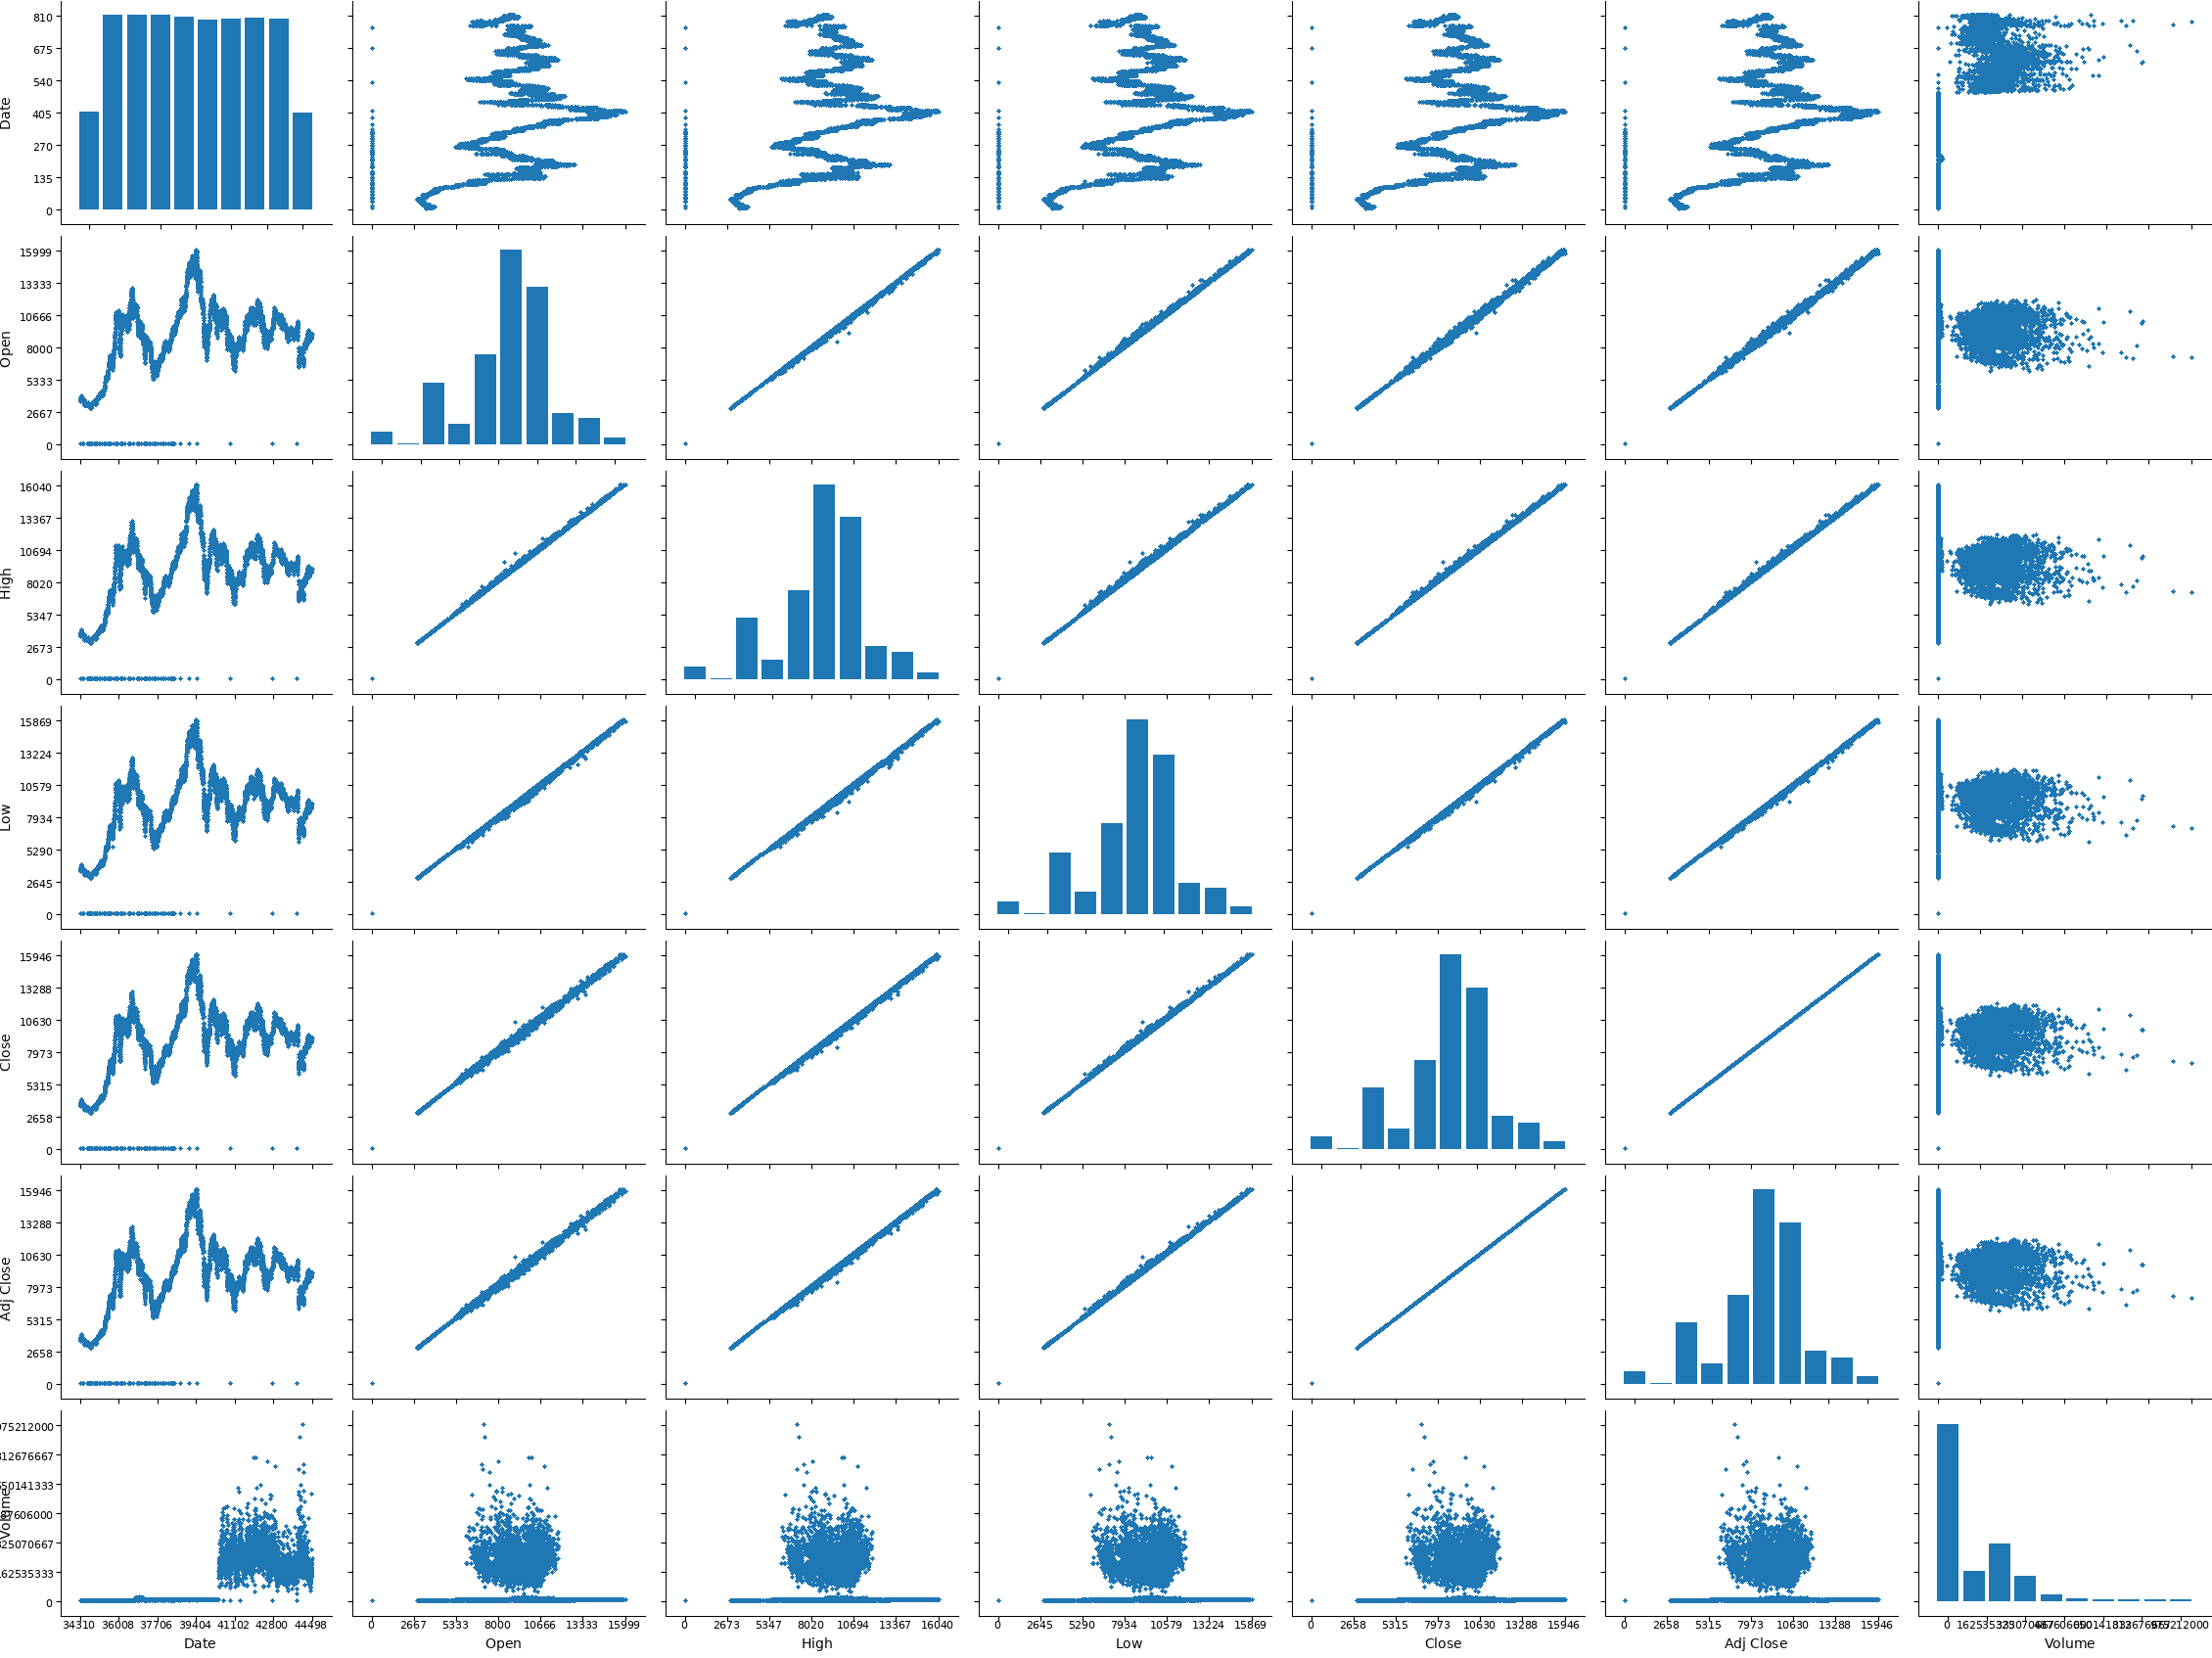
Sample of Pairplot():
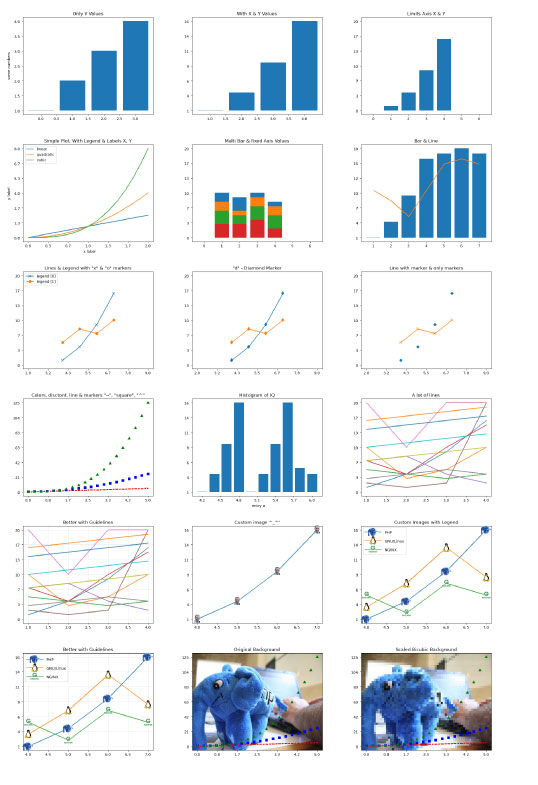
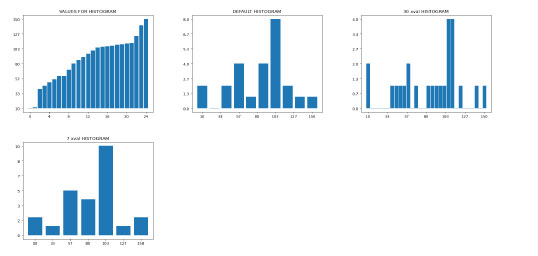
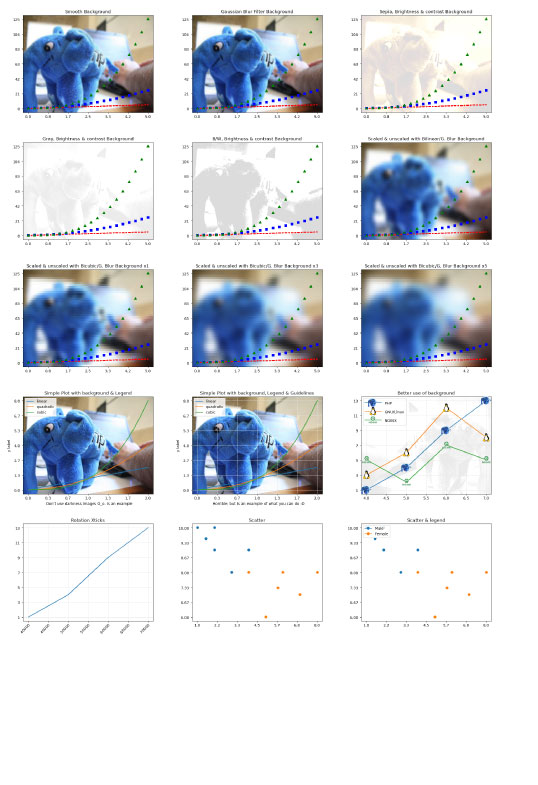
Other Samples that you can generate with php-libplot and provided by inside php-graph class:
REQUERIMENTS:
- Requires php-graph library: https://github.com/vivesweb/graph-php
- A minimum (minimum, minimum, minimum requeriments is needed). Tested on:
- Simple Raspberry pi (B + 512MB 700 MHz ARM11) with Raspbian Lite PHP7.3 (i love this gadgets) :heart_eyes:
- VirtualBox Ubuntu Server 20.04.2 LTS (Focal Fossa) with PHP7.4.3

- Ubuntu 20.04.3 LTS (Focal Fossa). Laptop Acer Extensa 5630 with PHP 7.4.3 (built: Aug 13 2021 05:39:12) ( NTS )

- Red Hat Enterprise Linux Server release 6.10 (Santiago) PHP Version 7.3.25 (Production Server) 512Mb Memory Limit
# SERVER REQUERIMENTS:
- PHP with GD enabled: sudo apt install php-gd

- If you need to use IMG_FILTER_SCATTER you need at least PHP >= PHP7.4.0. See official doc: https://www.php.net/manual/en/function.imagefilter.php

- PHP with Imagick for some functions. It is not required for by most methods, but in some, like reading pdf or psd, you will need it. Install: sudo apt install php-imagick

- Requires https://github.com/zaachi/PHP-Instagram-effects
# What if I don't have Imagick installed?:
If you do not have Imagick installed and perform some filter that use imagick, the system just won't apply that filter.
# FILES: There are 2 basic files:
php-libplot.class.php -> Master class. This file is the main file that you need to include in your code.
example.php -> example file
# NOTE: In this earlier version, for see the graph, you need to call output_gd_png_base64( ) and draw directly in <img> html object. See example file.
# INSTALLATION: A lot of easy :smiley:. It is written in PURE PHP. Only need to include the files. Tested on basic PHP installation
require_once( 'php-libplot.class.php' );
# BASIC USAGE:
      $plt = new php_plotlib();
      $plt->plot( [1, 1.5, 2, 1.8, 3] );
      $plt->plot( [2, 2.8, 1.7, 2, 2.3] );
      $plt->title("Multi Line");
      echo '<img src="'.$plt->output_gd_png_base64( ).'">';
RESUME OF METHODS:
- CREATE php_plotlib:
$tpl= new php_plotlib( );
- CREATE SUBPLOTS:
You can create subplots inside a plot and manage they individually.
subplots( $numyplots = null, $numxplots = null, $cfg = [ 'bordertype' => 'square', 'figsize' => [6.4, 4.8], 'paddingleft' => .2, 'paddingbottom' => .15 ])
$numyplots: Number of vertical subplots $numxplots: Number of horizontal subplots $cfg: Configuration of subplots: - bordertype: ['square' | 'halfsquare'] - figsize: size in inches (width, height), in inches - paddingleft: If you need space at left, you can to set here in inches - paddingbottom: If you need space at left, you can to set here in inches
Example:
    $plt = new php_plotlib();
    $plt->subplots( 2, 2 );
    $plt->subplots[0][0]->bar( [1, 2, 3, 4] );
    $plt->subplots[0][1]->bar( [10, 20, 30, 40] );
    $plt->subplots[1][0]->bar( [100, 200, 300, 400] );
    $plt->subplots[1][1]->bar( [11, 12, 13, 14] );

    echo '<img src="'.$plt->subplots[0][0]->output_gd_png_base64( ).'">';
    echo '<img src="'.$plt->subplots[0][1]->output_gd_png_base64( ).'">';
    echo '<br />';
    echo '<img src="'.$plt->subplots[1][0]->output_gd_png_base64( ).'">';
    echo '<img src="'.$plt->subplots[1][1]->output_gd_png_base64( ).'">';
- PAIRPLOT:
You can create a pairplot graph from csv dataset in array. First row need to be col names.
In $cfg array you can set the width of the markers: ['widthmarker' => 5]
pairplot( $dataset, $cfg = null )
example:
// read csv
$dataset = [];
if (($gestor = fopen("ibex35.csv", "r")) !== FALSE) {
  	while (($datos = fgetcsv($gestor, 1000, ",")) !== FALSE) {
  			$dataset[] = $datos;
} fclose($gestor);
}
$plt = new php_plotlib();
$plt->pairplot( $dataset, ['widthmarker' => 6] );?>
<img width="1900" src="<?php echo $plt->output_gd_png_base64( );?>">
IMPORTANT NOTE!!! For other methods read https://github.com/vivesweb/graph-php documentation. Example.php file of php-libplot class uses some of the php-graph methods directly (plot, bar, title, ...) as example of use: - bar() - plot() - title() - xlabel() - ylabel() - axes() - legend() - set_drawguidelines() - set_x_drawguidelines(9 - set_y_drawguidelines() - legendwidthlines() - legendlabelheight() - imread() - xticks() - scatter() - hist() - width() - height() - And a common math python funcions created in php as linspace, arraypow and others
Of course. You can use it freely :vulcan_salute::alien:
By Rafa.
@author Rafael Martin Soto
@author {@link http://www.inatica.com/ Inatica}
@blog {@link https://rafamartin10.blogspot.com/ Rafael Martin's Blog}
@since OCTOBER 2021
@version 1.0.3
@license GNU General Public License v3.0
| Screenshots | ||

| File | Role | Description |
|---|---|---|
| Example | Example script | |
| Data | Auxiliary data | |
| Lic. | License text | |
| Class | Class source | |
| Doc. | Example script |
| Version Control | Unique User Downloads | Download Rankings | |||||||||||||||
| 100% |
|
|
| Applications that use this package |
![]() If you know an application of this package, send a message to the author to add a link here.
If you know an application of this package, send a message to the author to add a link here.
| Related pages |
| Announcement of PHP-libplot |